4.1 Spreading of performance values
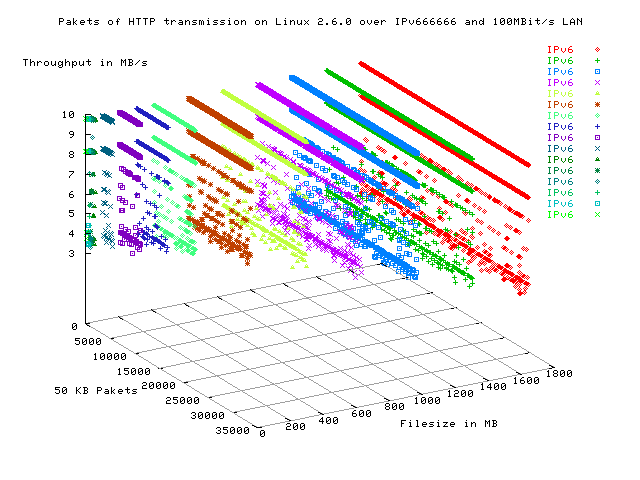
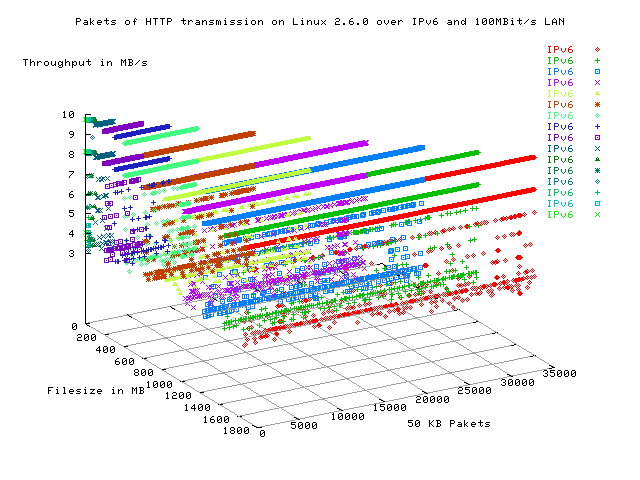
Up to now we only regarded medium values for our analyzation of Performance caracteristics which were computed out of the detailed values. But we recognized that the performance values raised by transmitting the same file ten times spread partially very intensivley. The abnormal fact is, that this effect happens although the ten files are transmitted in exactly the same testing environment - the same hardware, OS, protocol, etc. We tried to figure out how intensive this differences are and under which circumstances (OS, filesize) they occur with a particular intension.
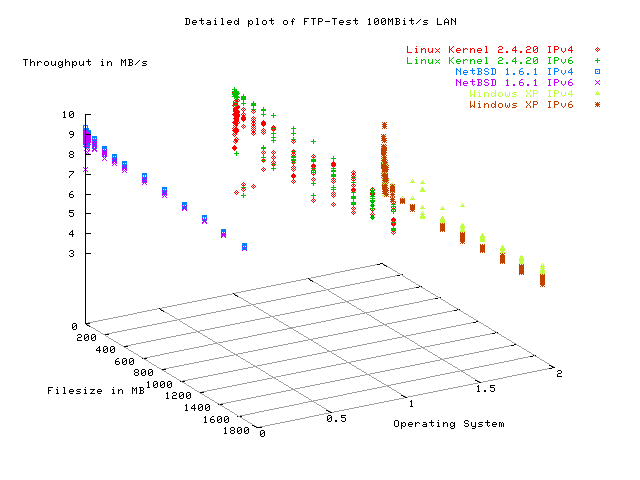
The following two diagrams show the perfomance throughput for the exact values. The two diagrams show exactly the same, only the z- and y- axis are in a different position.
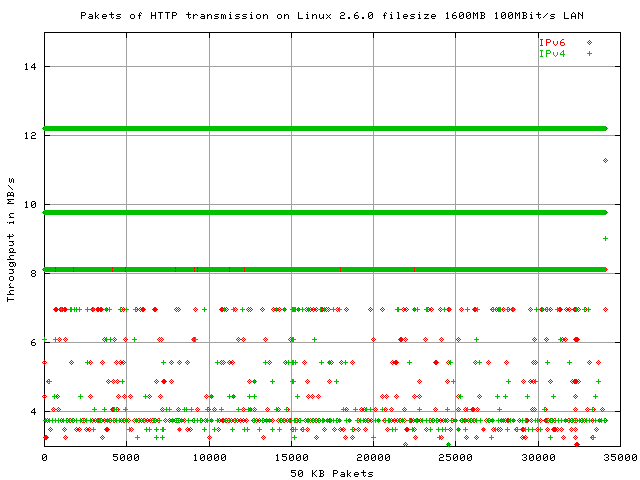
The following three diagrams show the same values as the previous 3D-diagrams in 2D representation:
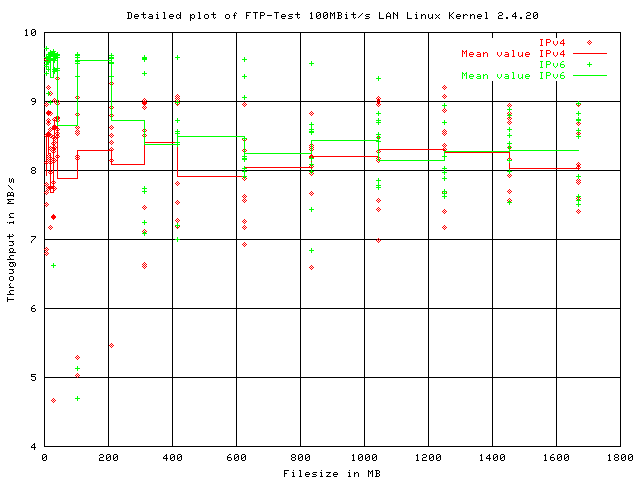
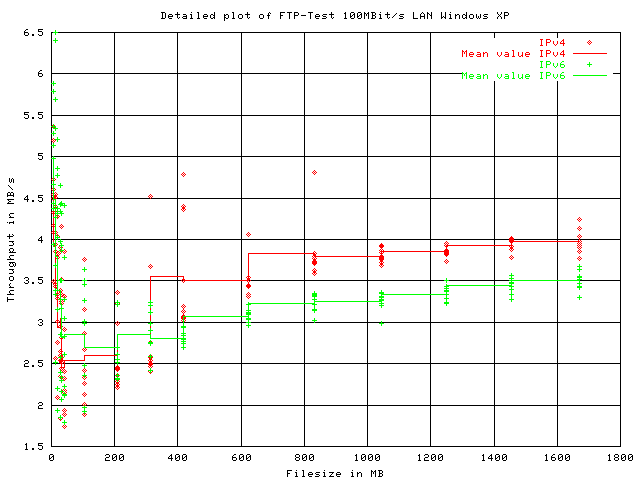
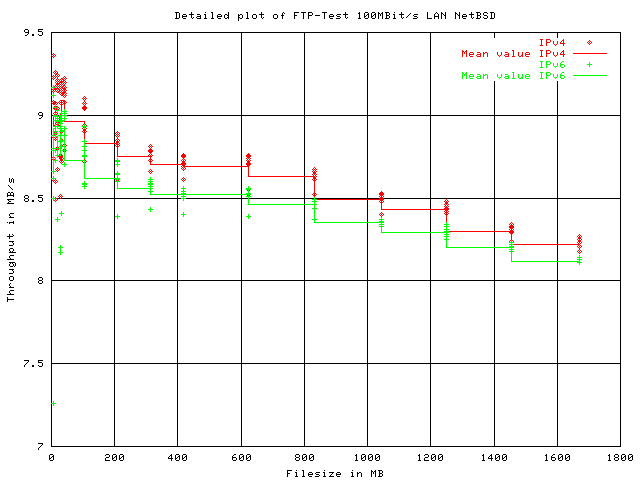
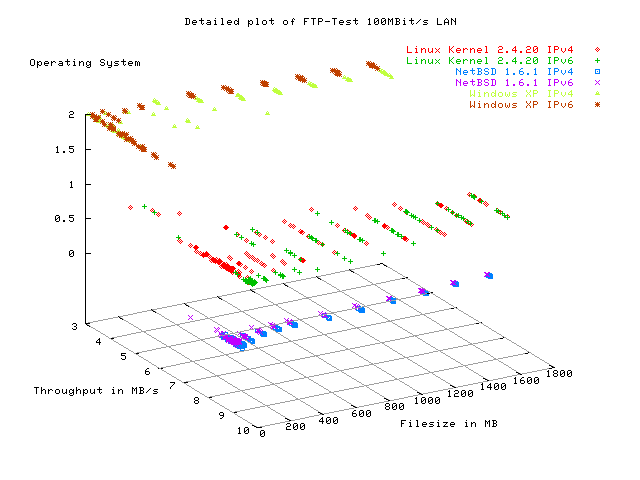
It is obvious that NetBSD produces the lowest spread values, while the distance between the minimum and maximum value produced by Linux is rather high. Microsoft is somwhere inbetween the two UNIXes. There seems to be no conjunction between the spread-effect and the used IP-protocol version.
4.2 Considering the single pakets of a data transmission
Our next step was to analyze the performance characteristics of the single files we had transmitted during their transmission. To achieve this, we analyzed the throughput values of the single pakets of which the file consists. The output of wget in its verbose mode is very interesting in this context. Wget shows performance values for each 50KB paket it had transmitted. Of course this pakets are not the same as what we mean when speaking of ethernet-frames, because an ethernet frame has a maximum size of about 1500 byte. But with the wget-output we are able to recognize possible influences on the throughput during the transmission of a file.